
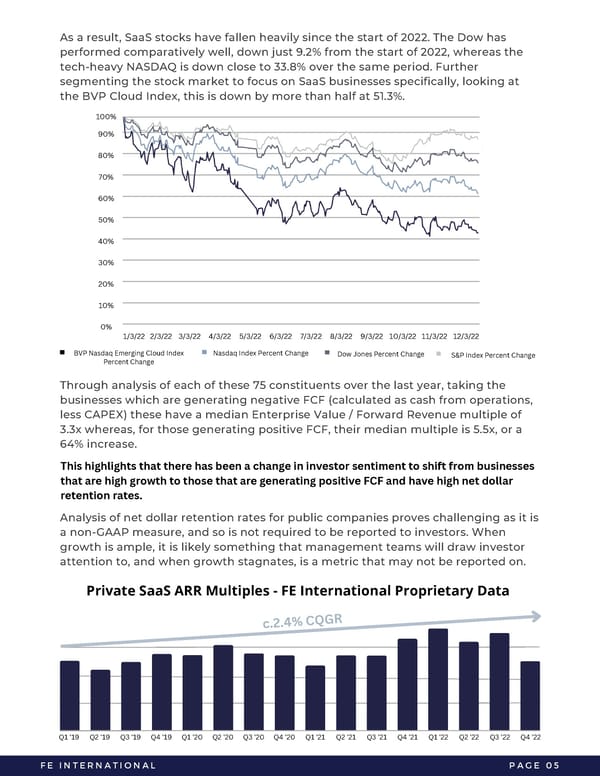
As a result, SaaS stocks have fallen heavily since the start of 2022. The Dow has performed comparatively well, down just 9.2% from the start of 2022, whereas the tech-heavy NASDAQ is down close to 33.8% over the same period. Further segmenting the stock market to focus on SaaS businesses specifically, looking at the BVP Cloud Index, this is down by more than half at 51.3%. 100% 90% 80% 70% 60% 50% 40% 30% 20% 10% 0% 1/3/22 2/3/22 3/3/22 4/3/22 5/3/22 6/3/22 7/3/22 8/3/22 9/3/22 10/3/22 11/3/22 12/3/22 BVP Nasdaq Emerging Cloud Index Nasdaq Index Percent Change Dow Jones Percent Change S&P Index Percent Change Percent Change Through analysis of each of these 75 constituents over the last year, taking the businesses which are generating negative FCF (calculated as cash from operations, less CAPEX) these have a median Enterprise Value / Forward Revenue multiple of 3.3x whereas, for those generating positive FCF, their median multiple is 5.5x, or a 64% increase. This highlights that there has been a change in investor sentiment to shift from businesses that are high growth to those that are generating positive FCF and have high net dollar retention rates. Analysis of net dollar retention rates for public companies proves challenging as it is a non-GAAP measure, and so is not required to be reported to investors. When growth is ample, it is likely something that management teams will draw investor attention to, and when growth stagnates, is a metric that may not be reported on. Private SaaS ARR Multiples - FE International Proprietary Data R G Q C % 4 . 2 . c Q1 '19 Q2 '19 Q3 '19 Q4 '19 Q1 '20 Q2 '20 Q3 '20 Q4 '20 Q1 '21 Q2 '21 Q3 '21 Q4 '21 Q1 '22 Q2 '22 Q3 '22 Q4 '22 FE INTERNATIONAL PAGE 05
 2023 M&A Report | SaaS Page 6 Page 8