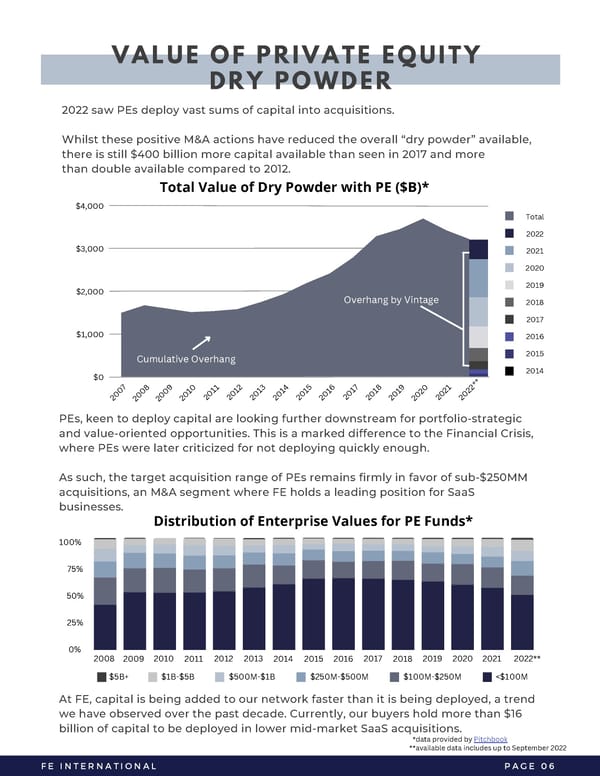
VALUE OF PRIVATE EQUITY DRY POWDER 2022 saw PEs deploy vast sums of capital into acquisitions. Whilst these positive M&A actions have reduced the overall “dry powder” available, there is still $400 billion more capital available than seen in 2017 and more than double available compared to 2012. Total Value of Dry Powder with PE ($B)* $4,000 Total 2022 $3,000 2021 2020 2019 $2,000 Overhang by Vintage 2018 2017 $1,000 2016 2015 Cumulative Overhang 2014 $0 ** 7 7 1 1 2 2 3 5 8 8 4 9 9 6 0 0 1 1 1 2 2 1 1 1 1 1 1 0 1 2 0 0 0 0 0 0 0 0 0 0 0 0 0 0 0 0 0 0 2 2 2 2 2 2 2 2 2 2 2 2 2 2 2 2 PEs, keen to deploy capital are looking further downstream for portfolio-strategic and value-oriented opportunities. This is a marked difference to the Financial Crisis, where PEs were later criticized for not deploying quickly enough. As such, the target acquisition range of PEs remains firmly in favor of sub-$250MM acquisitions, an M&A segment where FE holds a leading position for SaaS businesses. Distribution of Enterprise Values for PE Funds* 100% 75% 50% 25% 0% 2008 2010 2012 2013 2017 2019 2020 2021 2022** 2009 2011 2014 2015 2016 2018 $5B+ $1B-$5B $500M-$1B $250M-$500M $100M-$250M
 2023 M&A Report | SaaS Page 7 Page 9